
Starbucks, the iconic coffeehouse brand founded in Seattle in 1971, has become dominant in the U.S. beverage and retail space. With thousands of outlets spread across urban hubs, suburban neighborhoods, and college campuses, Starbucks is vital in shaping modern coffee culture. This report leverages web scraping Starbucks locations data in the USA to provide a detailed analysis of the company's national footprint. We aim to reveal geographic trends and strategic positioning by focusing on store counts and distribution patterns. The data collected as of March 2025 highlights Starbucks' presence across various demographic and economic zones. Businesses and analysts looking to scrape Starbucks store data across the United States can use such insights to evaluate market saturation, expansion potential, and regional popularity. This study also offers tools to extract Starbucks location data for the US, supporting competitive benchmarking and data-driven decision-making in the retail and food service sectors.
The data for this report was collected through web scraping, a technique used to extract structured information from websites. The primary sources included ScrapeHero, which provided detailed Starbucks location data as of March 10, 2025, and Statista, which offered supplementary statistics on store counts and market trends. Additional data was sourced from Xbyte.io and industry reports to cross-verify store numbers and demographic insights. The scraping process involved automated scripts to retrieve store counts, addresses, and operational details from Starbucks' official website and third-party aggregators. Python libraries such as BeautifulSoup and Scrapy were employed to parse HTML content, while pandas were used for data cleaning and analysis. For US Starbucks store mapping with web scraping, geospatial tools were utilized to visualize store distributions. To scrape Starbucks location data for US market insights, the report integrated population data from the U.S. Census Bureau. Starbucks food data scraping services supported broader insights into menu offerings and regional preferences.
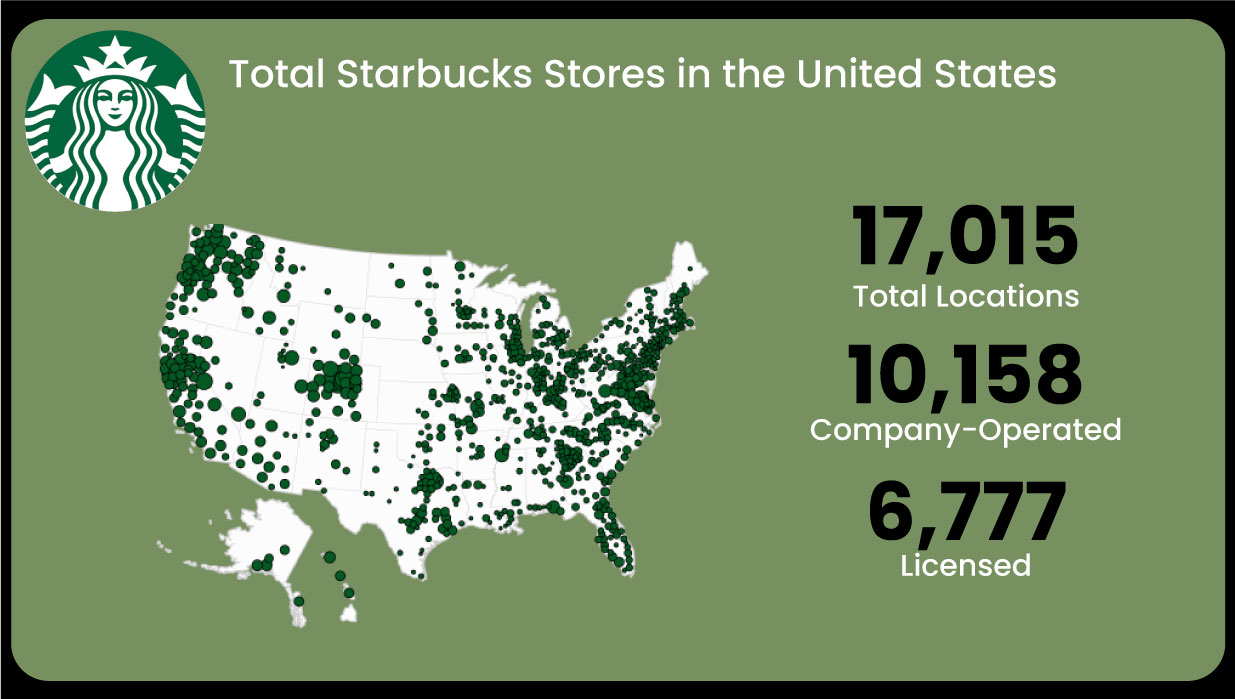
As of March 10, 2025, Starbucks operates 17,015 locations across the United States, including 10,158 company-operated stores and 6,777 licensed outlets. This expansive footprint reflects Starbucks' steady growth strategy and its focus on accessibility in diverse markets. The U.S. remains its largest market, accounting for nearly half its 35,711 global stores. With a national population of approximately 331 million, there is one Starbucks for every 19,500 people—an indicator of the brand's intense market penetration. This vast network includes everything from bustling urban cafés and suburban drive-thrus to licensed outlets in airports, shopping malls, and universities. Businesses aiming to extract Starbucks food delivery data can gain valuable insights into service patterns and regional demand. Similarly, Starbucks restaurant menu data collection allows analysts to explore product availability and pricing strategies. Comprehensive Starbucks restaurant data scraping supports competitive research, expansion planning, and a deeper understanding of consumer access points across varied U.S. locales.
Starbucks' store distribution varies widely by state, reflecting population density, consumer demand, and economic factors. California leads with 3,170 stores, accounting for 19% of U.S. locations and serving 39.5 million residents (one store per 12,464 people). Scrape Starbucks food delivery data to assess availability across high-density and low-density markets. Texas follows with 1,414 stores (9%), or one per 20,506 of its 29 million residents. Food delivery data scraping services can help analyze regional delivery options, particularly in vast states like Texas, which have diverse urban and rural areas.
Florida (913 stores), Washington (741 stores), and New York (645 stores) complete the top five, highlighting regional demand. Washington, Starbucks' home state, has a high density, with one store per 10,404 residents. Restaurant data scraping service tools can reveal customer access levels and delivery infrastructure differences across these states.
In contrast, states like Vermont (12 stores) and North Dakota (14 stores) have minimal presence due to lower population density.
The table below details the top 10 states by store count as of March 2025.
| State | Number of Stores | Percentage of Total | Population (Millions) | Stores per Million People |
|---|---|---|---|---|
| California | 3,170 | 19% | 39.5 | 80.3 |
| Texas | 1,414 | 9% | 29.0 | 48.8 |
| Florida | 913 | 5% | 21.5 | 42.5 |
| Washington | 741 | 4% | 7.7 | 96.2 |
| New York | 645 | 4% | 20.2 | 31.9 |
| Illinois | 629 | 4% | 12.8 | 49.1 |
| Pennsylvania | 510 | 3% | 13.0 | 39.2 |
| Colorado | 506 | 3% | 5.8 | 87.2 |
| Ohio | 502 | 3% | 11.7 | 42.9 |
| Virginia | 496 | 3% | 8.6 | 57.7 |

Starbucks thrives in cities renowned for its coffee culture, as identified by metrics like coffee shop density and consumer preferences. Seattle, Starbucks’ birthplace, leads with 92 stores, reinforcing its status as a coffee hub. New York City has the highest store count at 241, driven by its dense population and global influence. Chicago (184 stores), home to the enormous Starbucks Reserve Roastery, follows, alongside Miami (88 stores), Portland, Oregon (74 stores), and Orlando (72 stores). Florida’s strong representation reflects tourism and urban growth. These cities, identified through analyses like Yahoo’s coffee-friendliness rankings, highlight Starbucks’ strategy of targeting high-traffic urban centers with robust coffee demand.
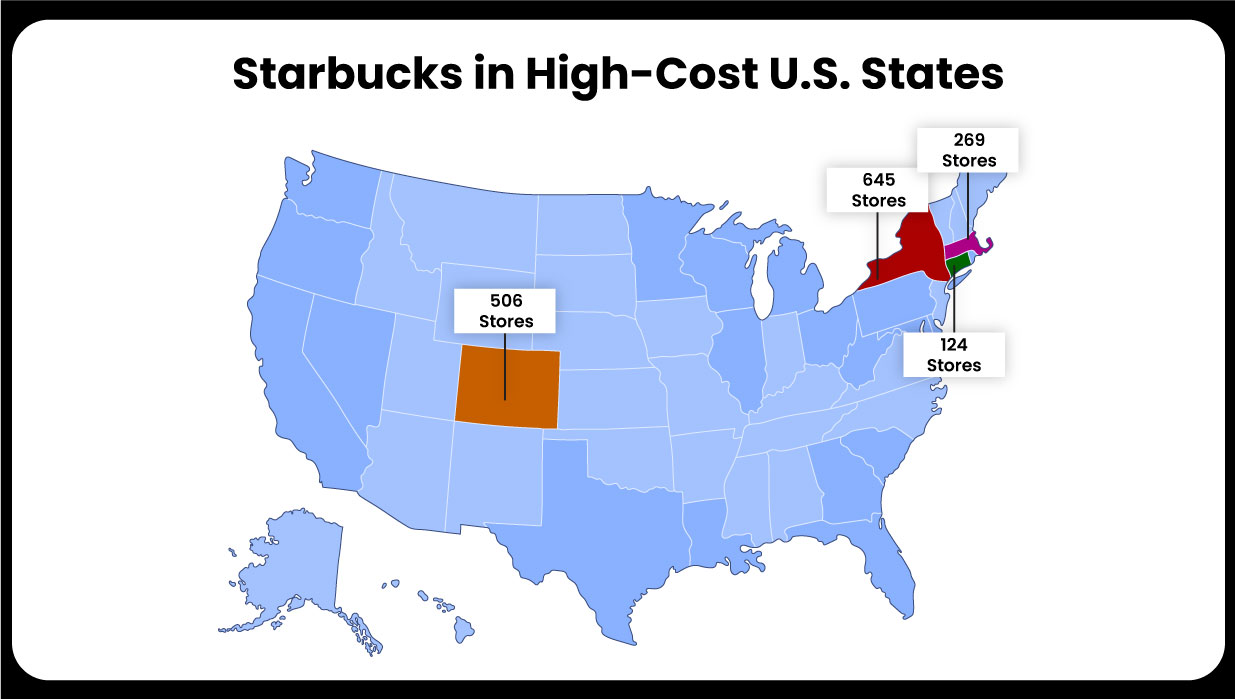
Starbucks’ presence in high-cost states aligns with its premium brand. With 3,170 stores, California dominates due to its high living costs and affluent population. Other expensive states, per the U.S. Bureau of Economic Analysis, include New York (645 stores), Massachusetts (269 stores), Connecticut (124 stores), and Colorado (506 stores). These states, with high median incomes, support Starbucks’ pricing model (e.g., $3.26 for a Tall Latte). The company’s focus on these regions targets consumers willing to pay for quality and convenience, balancing premium offerings with broad accessibility.
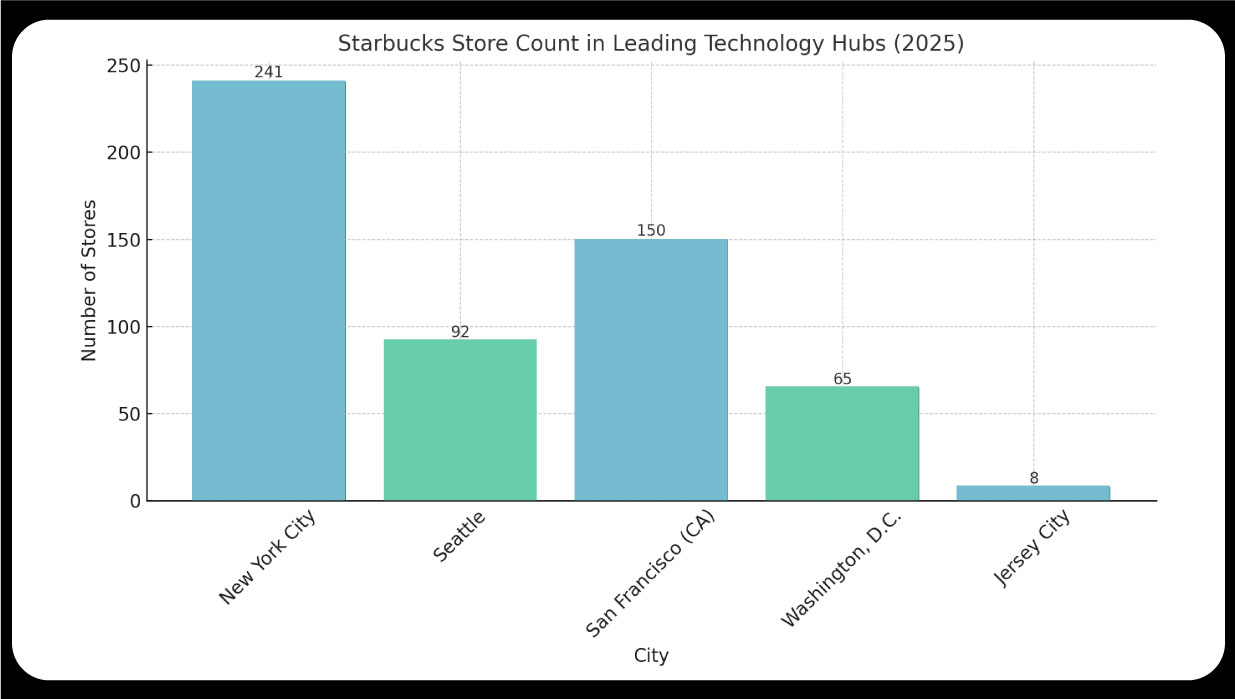
Starbucks has a strong foothold in tech-driven cities, catering to professionals and innovators. New York City (241 stores), Seattle (92 stores), and San Francisco (part of California’s 3,170 stores) lead, followed by Washington, D.C. (65 stores) and smaller hubs like Jersey City (8 stores). These cities, home to tech giants like Amazon and Microsoft, align with Starbucks’ digital innovations, such as mobile ordering and the Starbucks Rewards program. The brand’s workspace and social hub role enhance its appeal in these fast-paced, tech-savvy environments

Starbucks’ location strategy optimizes market coverage through geospatial intelligence. California’s dominance reflects its population and urban density, while Texas and Florida capitalize on growth and tourism. Coffee-loving cities like Seattle and Portland underscore cultural alignment, and high-cost states and tech hubs target affluent and professional demographics. Web scraping food delivery app data reveals how Starbucks aligns store formats with local demand. Customer engagement is strong, with 86% of 4.4 million reviews rating stores as “excellent” or “good.” Drive-thrus (highest in California) and Reserve Roasteries (e.g., Chicago) diversify offerings, balancing convenience and premium experiences. Food data scraping services support these insights, highlighting Starbucks’ adaptability in a competitive market.
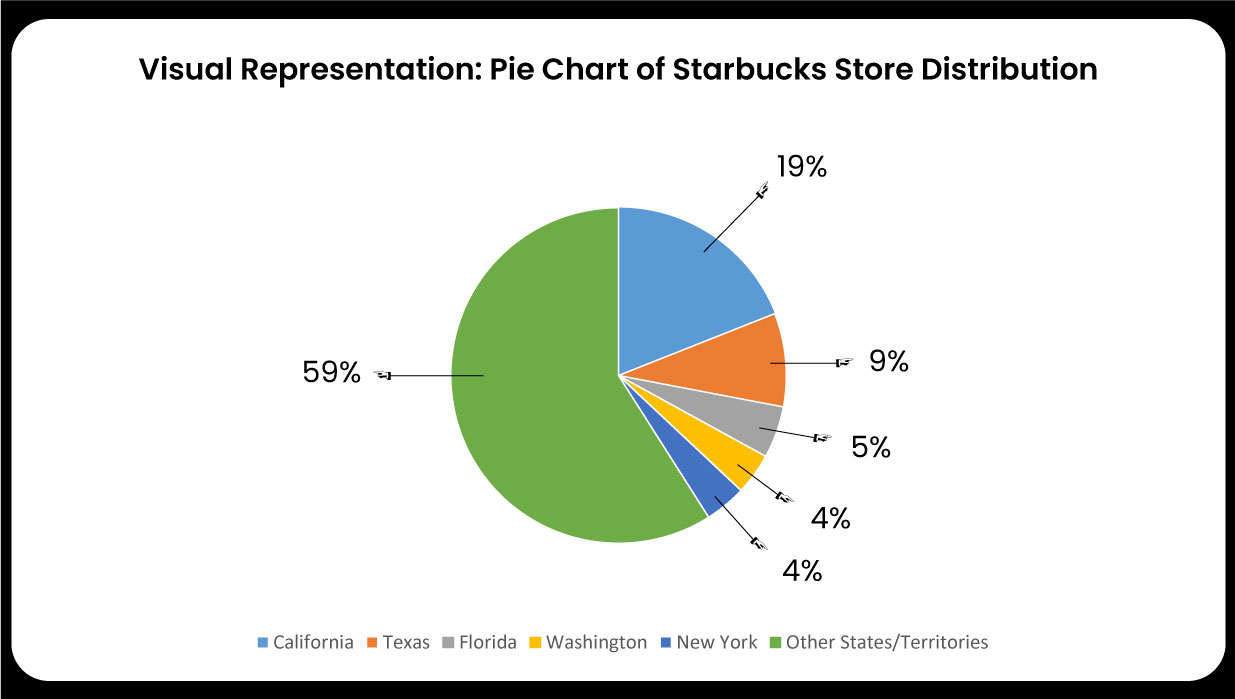
The pie chart below illustrates the distribution of Starbucks stores across the top five states and the remaining U.S. states and territories, emphasizing California’s significant share.
Pie Chart Description: The chart displays California (19%), Texas (9%), Florida (5%), Washington (4%), New York (4%), and Other States/Territories (59%) as segments, with store counts labeled.
As of March 2025, Starbucks operates 17,015 stores across the U.S., showcasing its stronghold in the national coffee market. Concentrated in high-density states like California and iconic cities such as New York and Seattle, Starbucks leverages strategic placement to maximize reach and impact Food delivery data intelligence services reveal how store accessibility complements its premium image. Utilizing restaurant data intelligence services , web-scraped data highlights its dominance in both urban and suburban markets. Additionally, food delivery app menu datasets help track evolving consumer preferences, affirming Starbucks’ role as an innovative and culturally significant leader in American coffee consumption.
Experience top-notch web scraping service and mobile app scraping solutions with iWeb Data Scraping. Our skilled team excels in extracting various data sets, including retail store locations and beyond. Connect with us today to learn how our customized services can address your unique project needs, delivering the highest efficiency and dependability for all your data requirements.
We start by signing a Non-Disclosure Agreement (NDA) to protect your ideas.
Our team will analyze your needs to understand what you want.
You'll get a clear and detailed project outline showing how we'll work together.
We'll take care of the project, allowing you to focus on growing your business.