3,505
TOTAL REVIEWS
Amazon data scraping service in action: see how a plant-based yogurt brand's 16-SKU catalog, three-seller price tiers, and one hero flavor reveal a focus-first playbook.
A good Amazon data scraping service does not just count products and reviews — it reveals the strategy hiding inside the numbers. We rebuilt a small, fiercely loyal plant-based yogurt brand's Amazon presence from public data to show what disciplined extraction uncovers about a brand built on focus rather than funding. If you grow, defend, or invest in consumer brands, this teardown is for you. It speaks directly to:
Cocojune is the rare brand that proves restraint can be a strategy. The plant-based, coconut-based yogurt maker built a genuine cult following on Amazon without a single dollar of venture funding and without a bloated catalog. Where most brands chase scale, Cocojune chased belief — organic, probiotic, earth-friendly — and let a small, deliberate product line carry the message.
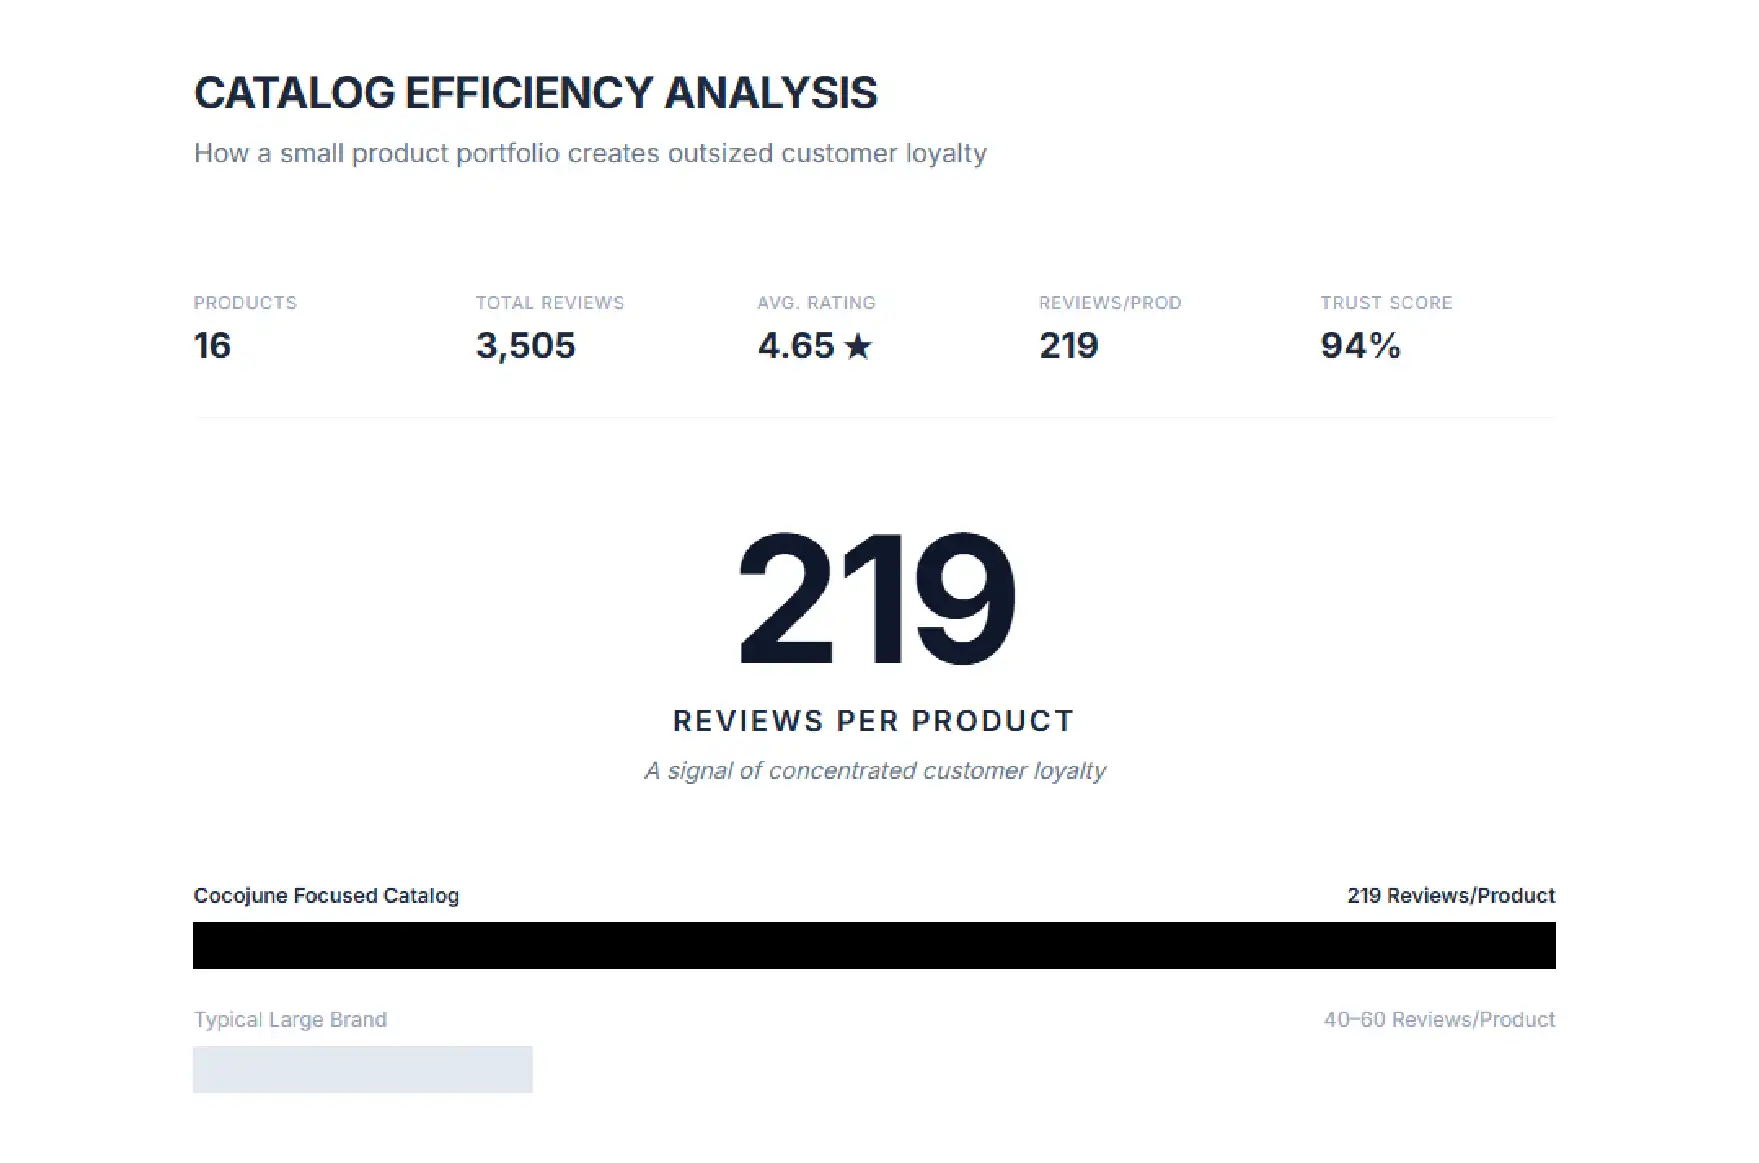
Working only from public marketplace data, an Amazon data scraping service can reconstruct that strategy with precision. The numbers are striking for their efficiency: just 16 products across five categories, yet 3,505 reviews at a remarkable 4.65-star average, a $6.65 blended price, and only three sellers on the platform. This is not a brand winning on volume. It is a brand winning on loyalty per product.
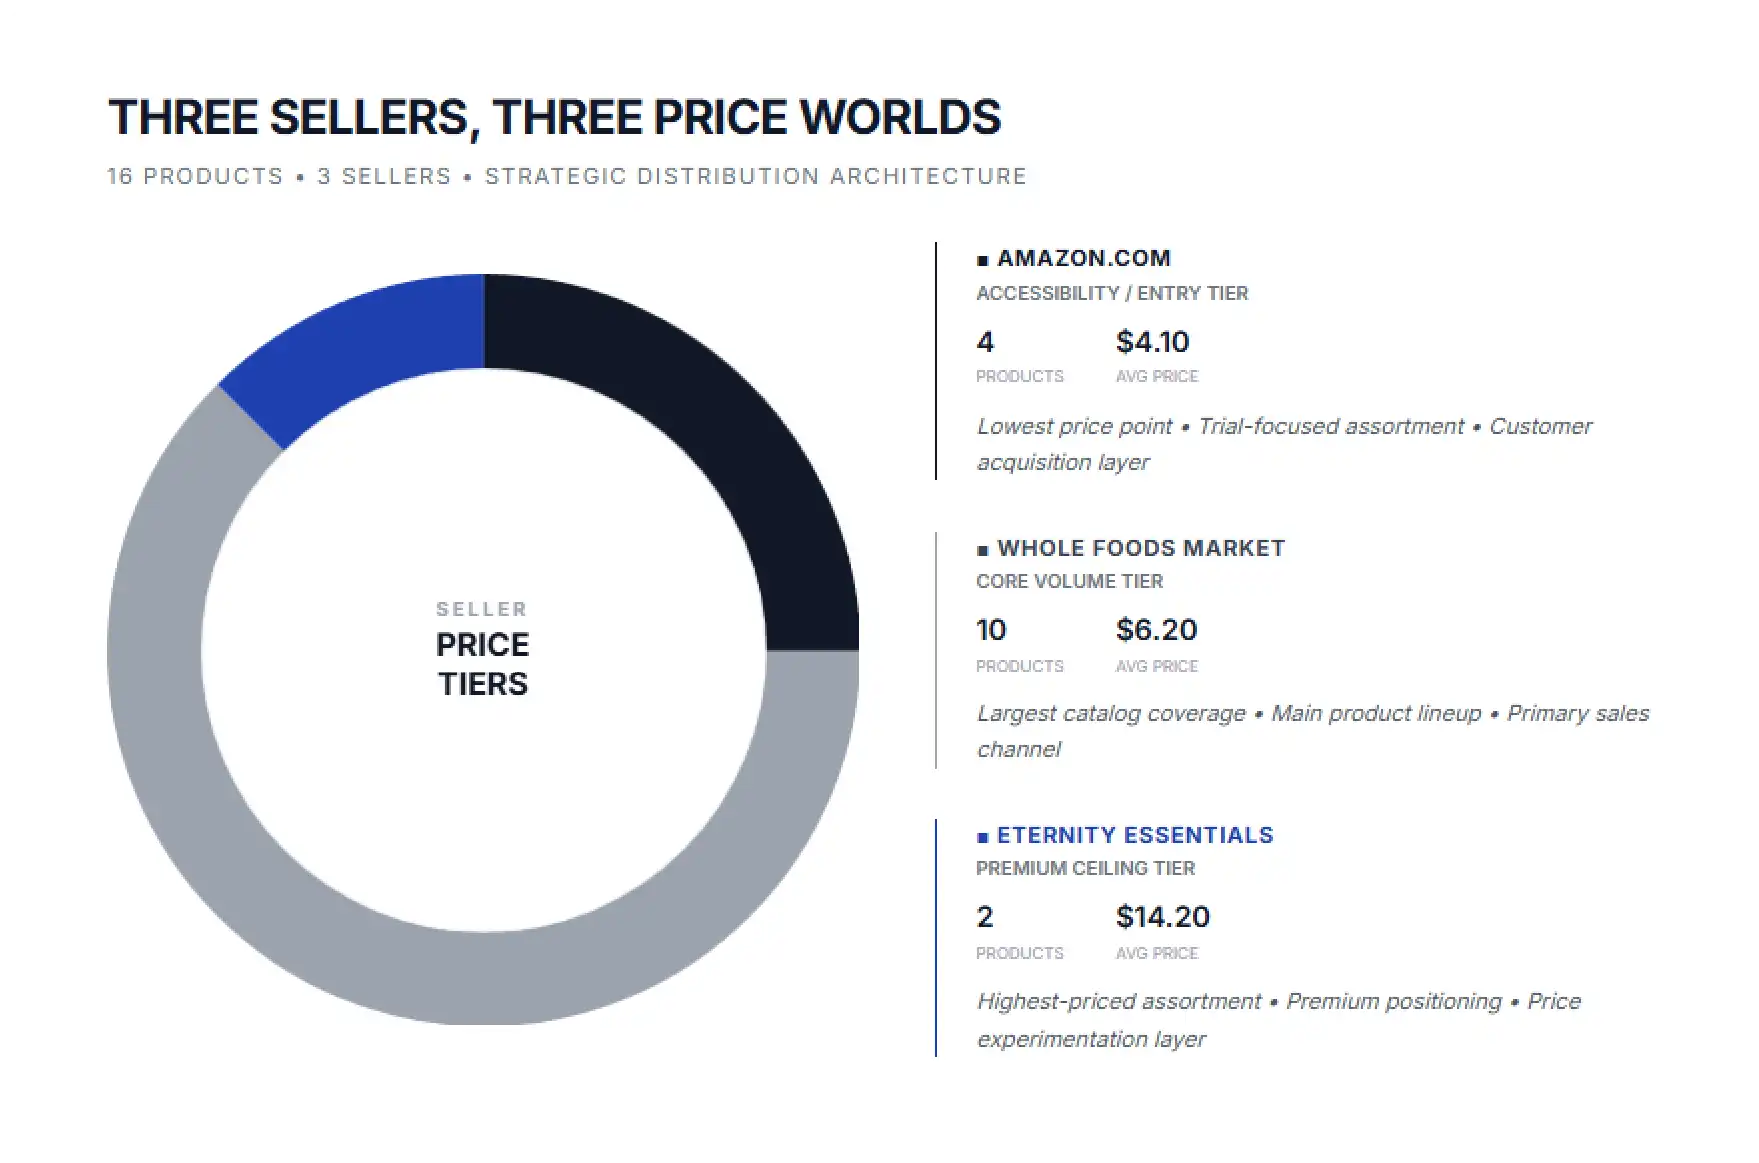
The most revealing pattern is not in the products at all — it is in the sellers. Three distinct sellers occupy three distinct price bands: Amazon.com handles accessibility at a $4.10 average, Whole Foods Market anchors the core at $6.20, and a third seller quietly tests a premium ceiling at $14.20. Conventional analysis lists these as a distribution footnote. Our unique angle reads them as the brand's actual price ladder — segmentation outsourced to the seller mix rather than engineered into a sprawling SKU range. This report walks through six findings and what the same approach reveals about any brand you study.
Reading a single product page is easy. Turning a brand's full Amazon presence — across every product, format, and seller — into a clean, comparable dataset is a different problem, and it is where most internal projects stall. The marketplace is built to resist collection at scale.
First, retailers actively defend against automated access with rate limits, rotating layouts, bot detection, and CAPTCHAs that break naive scrapers. Second, pricing is not one fixed number; it moves by the minute and varies by seller, Buy Box winner, coupon, and subscription offer — so a brand sold by three different sellers shows three different prices for what looks like the same product. Third, the underlying HTML changes constantly, so a selector that worked last week silently returns blanks this week, and the failure is invisible until someone audits the totals.
There is also a structural trap most teams never notice. Amazon groups size and format options under a parent listing, and reviews are frequently pooled across that family — which matters enormously when a brand sells one flavor in a 4oz single, a 1lb tub, and a multiserve pack. Read those in isolation and you either triple-count or lose the connection entirely. The value of a managed service is not the script; it is the resilient pipeline and the verification that turn raw pages into something trustworthy.
Before the findings, it is worth being honest about the build-versus-partner decision. Here is how a do-it-yourself stack typically compares with a managed service across the dimensions that decide whether the data is usable.
| Dimension | DIY Scraping | iWeb Data Scraping |
|---|---|---|
| Setup time | Weeks of engineering before the first clean dataset | Live within days, scoped to your brand |
| Anti-bot handling | Constant firefighting against blocks and CAPTCHAs | Managed proxy and detection layer, handled for you |
| Multi-seller logic | Same product, different sellers, easily confused | Each seller and price resolved cleanly |
| Format / variation | Reviews miscounted across pack sizes | Parent-child mapping resolved explicitly |
| Data accuracy | Silent failures; blanks pass as real values | Validated, deduplicated, QA-checked records |
| Maintenance | Breaks whenever the site layout changes | Pipeline upkeep included, zero overhead |
| Total cost | Hidden in engineering hours and rework | Predictable, decision-ready deliverable |
Cocojune makes organic, coconut-based yogurt and sells a philosophy as much as a product: probiotic, earth-friendly, and deliberately uncompromising. The brand grew without venture capital, which shapes everything visible on its Amazon page — there is no sprawling catalog built to chase every shelf, just a tight line that reflects a clear belief.
That discipline shows in the math. Sixteen products across five categories is a small footprint by marketplace standards, yet the brand has earned 3,505 reviews at a 4.65-star average — a level of devotion most catalogs three times the size never reach. The core yogurt sits comfortably under $10, with a $6.65 blended price that signals accessibility rather than luxury. The goal is not to be the premium choice; it is to be in every health-conscious fridge.
What makes Cocojune an ideal teaching case is that the entire strategy is publicly observable. The products offered, the prices set, the reviews earned, and the sellers competing all sit in plain sight. A focused brand leaves a focused data footprint — and reading it carefully shows exactly how restraint, not spend, built the following.
We approached Cocojune's Amazon presence the way our data scraping service approaches any brand: as a structured collection problem with a verification layer on top. The deliverable was never a pile of HTML — it was a clean dataset a strategist could trust on a Monday morning.
We enumerated every live product tied to the brand, capturing ASIN, title, category, price, star rating, review count, and — critically for this brand — the selling entity behind each listing. We resolved the parent-child relationships so the same flavor sold in a 4oz single, a 1lb tub, and a multiserve pack was mapped as related formats rather than triple-counted, and so pooled reviews were flagged rather than double-counted. Prices were captured with timestamps and tagged by seller, because for Cocojune the seller is part of the price story.
Every record passed through validation: empty fields were re-fetched instead of accepted as zeros, outliers were checked against the live page, and duplicates were collapsed. Only then did we analyze — review efficiency, the hero-format pattern, the price ladder, the premium tier, and the seller distribution that closes this report.
The first thing the data makes obvious is efficiency. Across just 16 products, Cocojune has earned 3,505 reviews at a 4.65-star average. Plenty of brands carry five times the catalog and never reach that rating. The combination of a small footprint and a high average is the clearest possible signal of a loyal, repeat-buying customer base rather than a one-time-curiosity crowd.
Reviews per product is a metric most analysis skips, yet here it is the whole story: a focused brand earns devotion that a sprawling one dilutes. A 4.65 average across thousands of reviews tells a shopper the brand reliably delivers, which lifts conversion and rank — and for a bootstrapped company with no ad war chest, that organic trust is the growth engine.
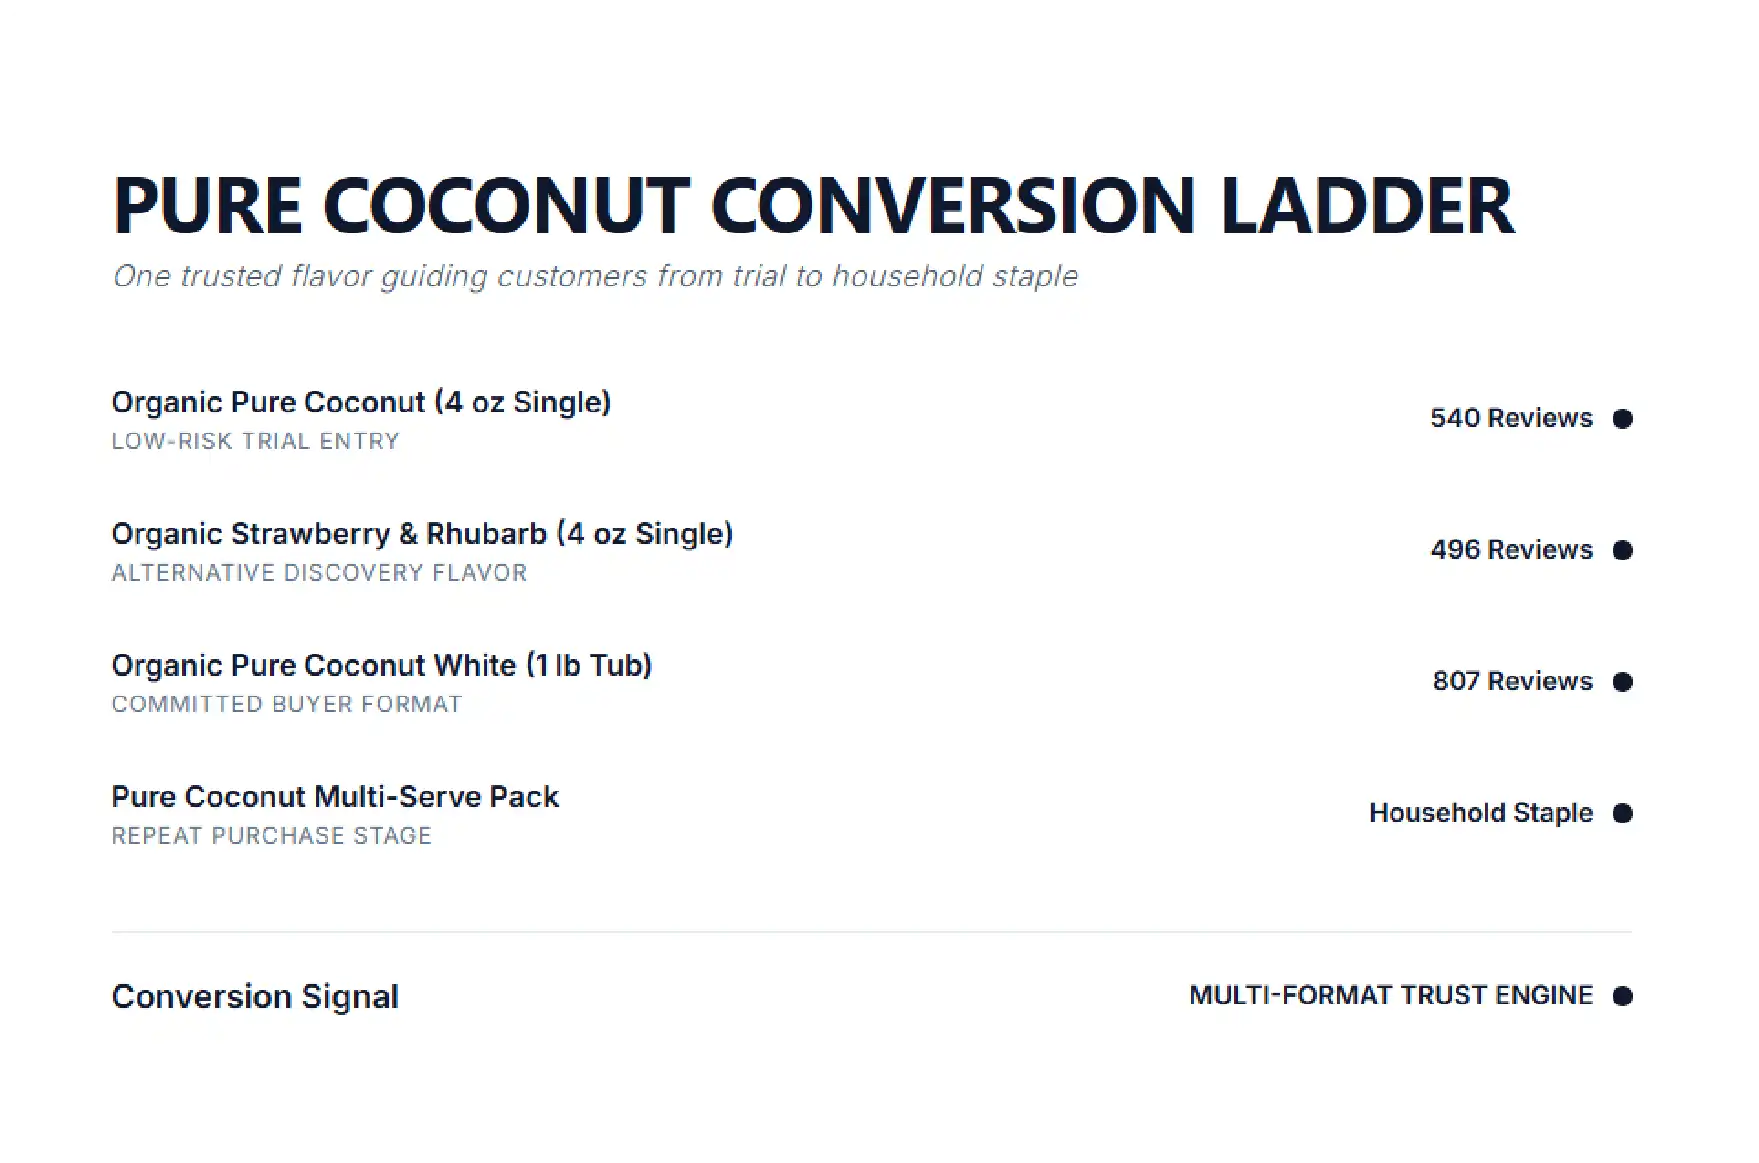
When you rank the catalog by reviews, a clear pattern emerges: customers come for trust, not novelty. The top-reviewed products are the plainest ones, and one flavor dominates the leaderboard.
| Product | Format | Reviews | Rating |
|---|---|---|---|
| Organic Pure Coconut White | 1 lb tub | 807 | 4.8 |
| Organic Pure Coconut | 4 oz single | 540 | 4.6 |
| Organic Strawberry & Rhubarb | 4 oz single | 496 | 4.6 |
The detail that turns this into a strategy is format. Pure Coconut does not appear once — it shows up as a 4oz single, a 1lb tub, and a multiserve pack. That is not redundancy; it is a deliberate conversion ladder built around a single trusted flavor. The 4oz single is the low-risk trial, the 1lb tub is the committed-buyer purchase, and the multiserve pack is the household staple. Pure Coconut is the product that turns a curious first-timer into a repeat customer, packaged for every stage of that journey. Spotting this requires resolving formats as related listings rather than separate products — exactly the kind of mapping a casual scrape misses.
SEE YOUR OWN CATALOG THIS CLEARLY
Picture this same review-efficiency and format view for your brand or a competitor. Our Amazon data scraping service can deliver a clean, structured dataset for any category in days. Email info@iwebdatascraping.com to scope it.
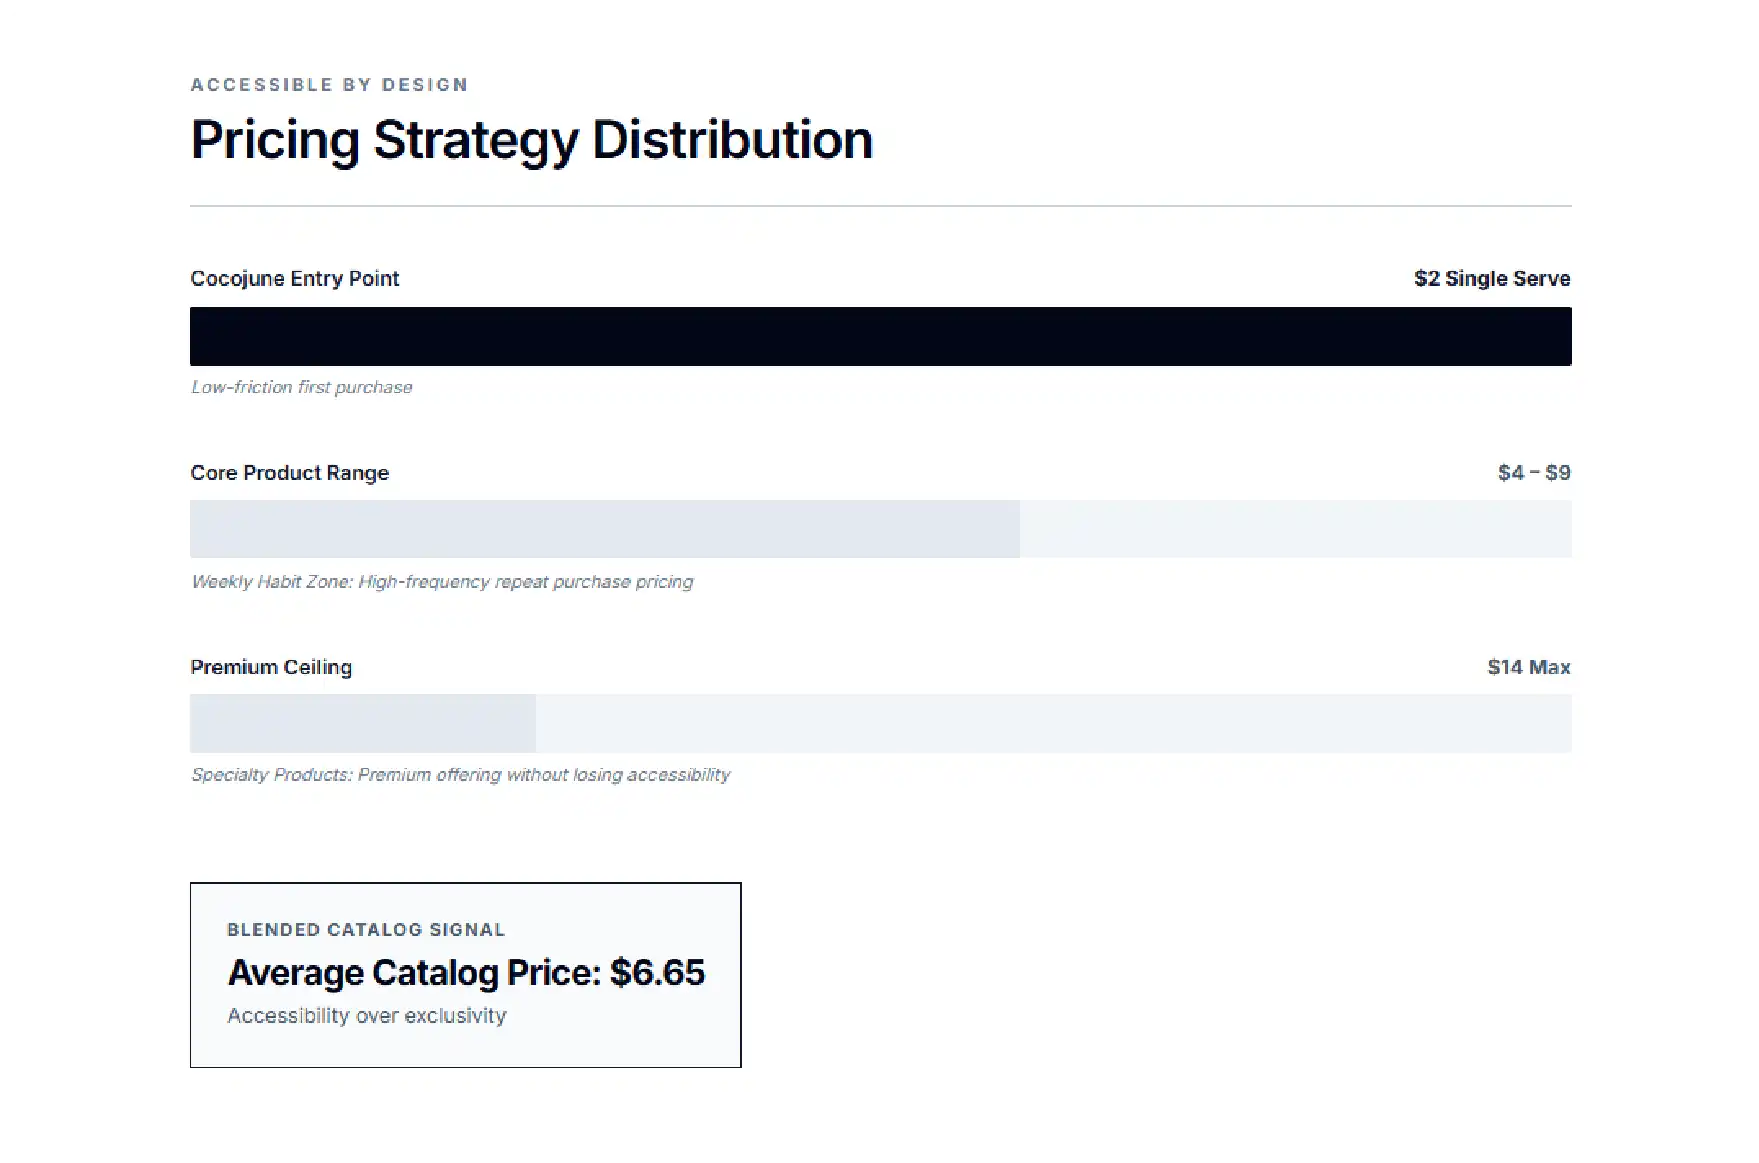
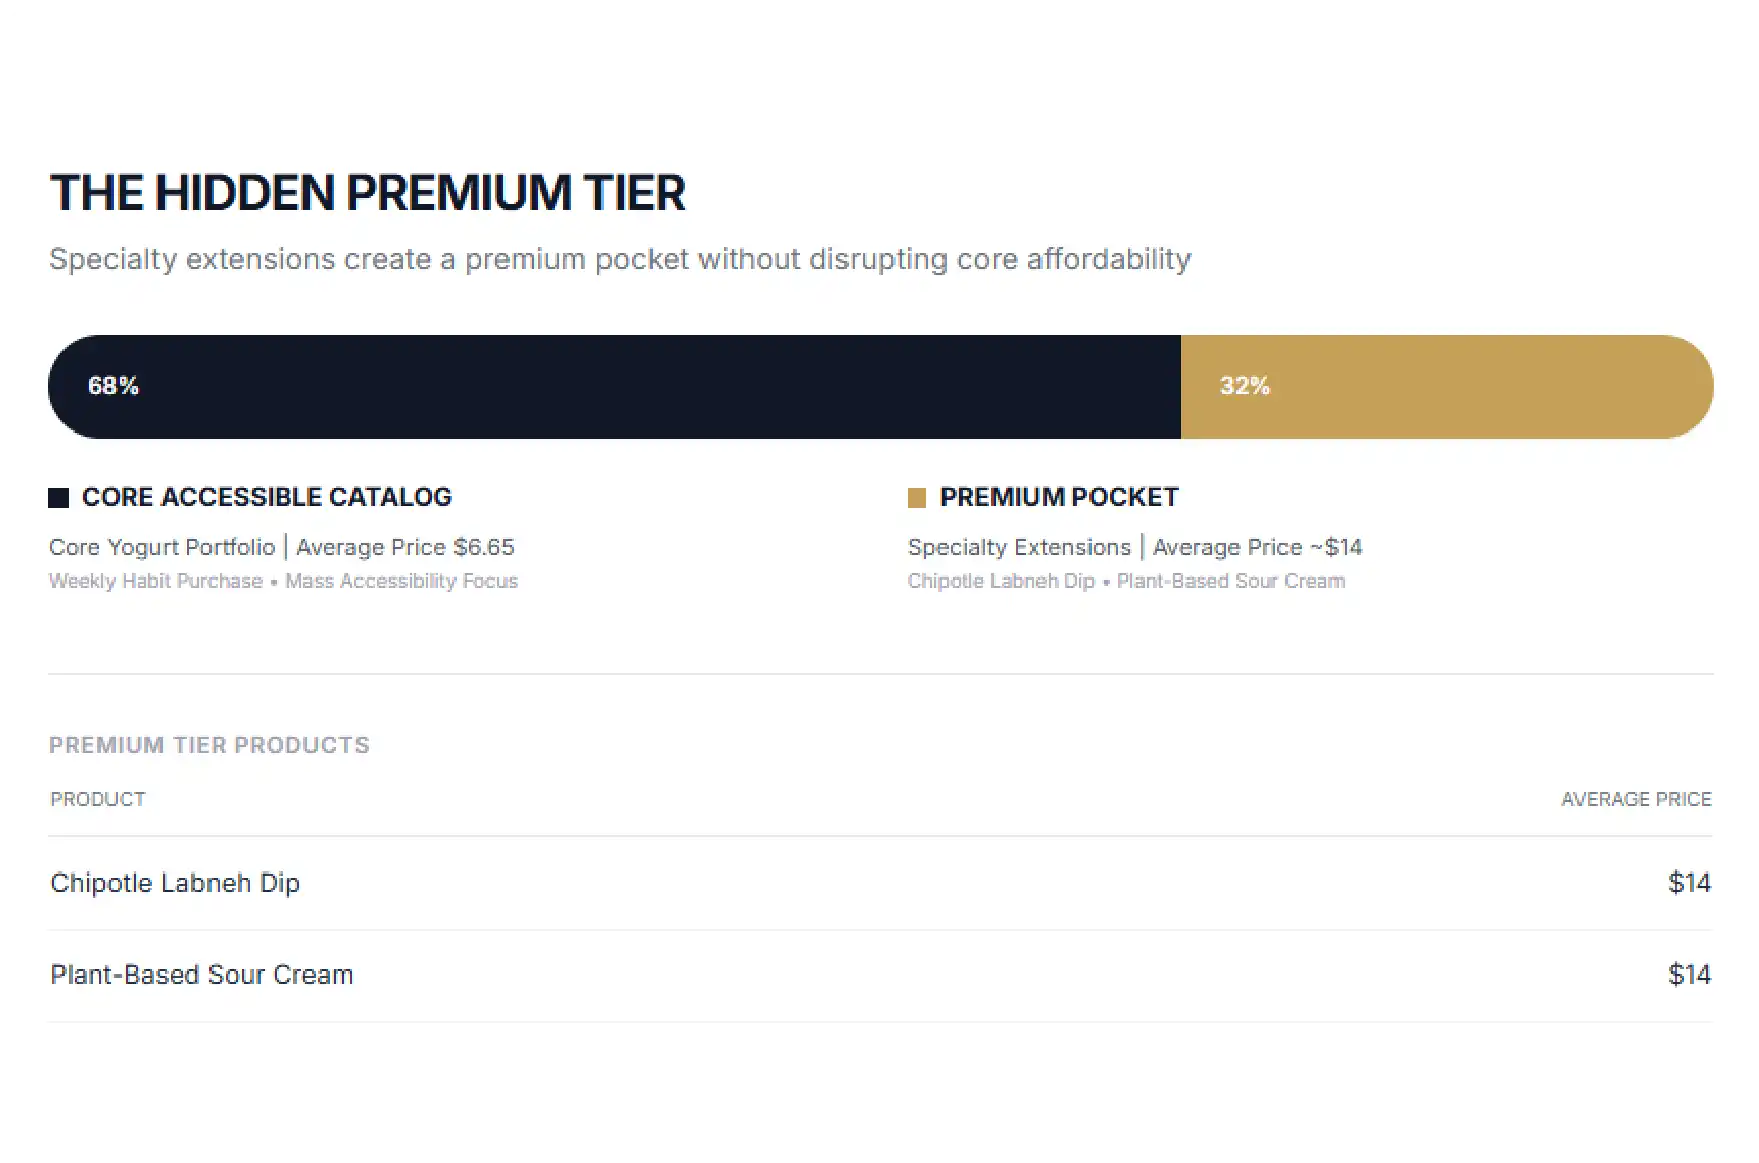
Cocojune's pricing tells you who it is trying to reach. The range runs from a $2 entry — a 4oz single serve — up to a $14 specialty item, but the heart of the catalog, the core yogurt lineup, sits comfortably under $10. The blended price across everything is $6.65.
That number is a statement of intent. A brand chasing premium positioning would let its blended price drift upward; Cocojune holds it low because the goal is ubiquity, not exclusivity. The $2 single is a deliberate trial mechanic, and the sub-$10 core is priced to become a weekly habit rather than an occasional treat. For a brand with no advertising budget, accessible pricing is itself a customer-acquisition tool: it lowers the barrier to the first purchase, and the 4.65 rating does the rest. The strategy is to be in every health-conscious fridge, and the price field proves it.
Hero's $16.59 average sits in a deliberate middle ground: affordable enough for an impulse buy, premium enough to avoid looking cheap. That balance works well in skincare, where too low reads as ineffective and too high reads as inaccessible. The catalog spreads cleanly from low-risk entry products to higher-priced treatment items.
The most distinctive signal in the entire dataset is the seller distribution. Only three sellers carry the brand on the platform, and each occupies a strikingly different price band.
| Seller | Products | Avg Price | Apparent Role |
|---|---|---|---|
| Amazon.com | 4 | $4.10 | Accessibility / entry |
| Whole Foods Market | 10 | $6.20 | Core lineup / volume |
| Eternity Essentials | 2 | $14.20 | Premium ceiling / test |
Read in isolation, this looks like a routine distribution footnote. Read together, it is remarkable: the three sellers are not selling the same thing at the same price — they are each anchored to a different tier. Amazon.com carries a small, low-priced set built for accessibility, Whole Foods Market holds the bulk of the catalog at the core price, and a third seller, Eternity Essentials, sits more than three times higher, quietly testing what the brand can command at the top. That spread across sellers is the setup for the unique read that follows.
THE COMPETITIVE REALITY
A brand's true pricing strategy is rarely on one product page — it is scattered across sellers, formats, and categories. Pull only what is in front of you and you will misread the whole picture. The structure is only visible when every seller is captured cleanly.
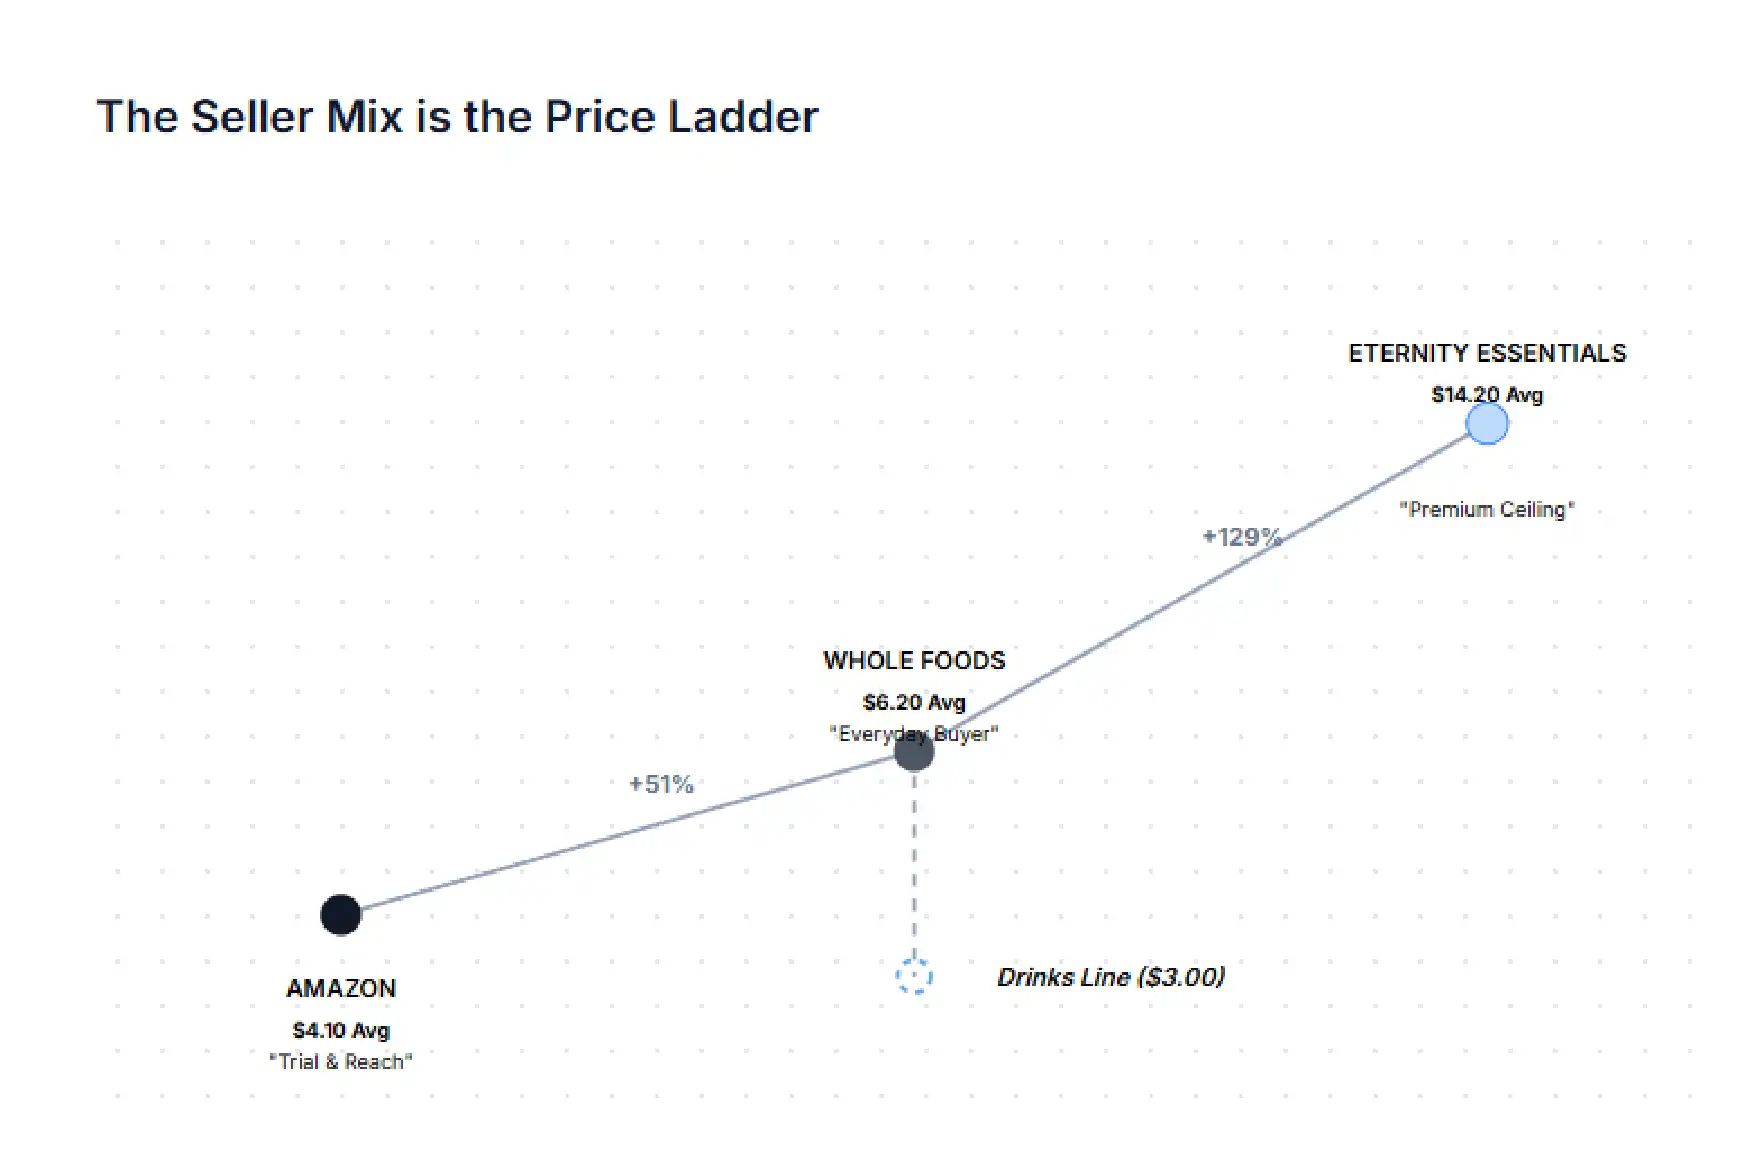
Here is the angle the surface-level breakdown never reaches. Most brands build a price ladder inside their own catalog — entry, core, and premium SKUs engineered into one range. Cocojune, with only 16 products and no funding to manage a complex assortment, appears to do something different: it lets its three sellers be the ladder. The segmentation is not built into the products; it is distributed across the distribution.
Look at how cleanly the rungs fall. Amazon.com is the entry rung at $4.10, designed for trial and reach. Whole Foods Market is the core rung at $6.20, where the everyday buyer lives. Eternity Essentials is the premium rung at $14.20, probing the ceiling. A brand that wanted entry, core, and premium tiers would normally need a sprawling SKU range and the overhead to manage it. Cocojune gets the same three-tier coverage almost for free by choosing sellers that each occupy a band — an elegant way for a bootstrapped company to span a market without building the ladder itself.
The most telling detail is the rung nobody has claimed yet. The brand's drinks line is its most underrepresented category — three products, zero reviews, and a roughly $3 average price. Whether that gap is intentional or simply overlooked, the data cannot say, but it is exactly the kind of opening this analysis exists to surface: an untested rung in a ladder that is otherwise working. The broader lesson for any focused brand is that your pricing architecture may not live in your catalog at all — it may live in your seller mix, visible only when every seller, format, and price is captured as one connected picture rather than a scatter of pages.
Below is a representative slice of the structured dataset behind this report. Each record is the kind of clean, comparable row our pipeline delivers — and reading the Seller and Price columns together is what makes the seller-as-ladder pattern in Finding 6 visible.
| ASIN | Product | Category | Price | Rating | Reviews | Seller |
|---|---|---|---|---|---|---|
| B07COCxxxx | Organic Pure Coconut White, 1lb | Yogurt | $6.99 | 4.8 | 807 | Whole Foods |
| B08CO4xxxx | Organic Pure Coconut, 4oz | Yogurt | $2.00 | 4.6 | 540 | Amazon.com |
| B08STRxxxx | Organic Strawberry & Rhubarb, 4oz | Yogurt | $2.00 | 4.6 | 496 | Amazon.com |
| B09VANxxxx | Organic Vanilla, 1lb | Yogurt | $6.49 | 4.7 | 318 | Whole Foods |
| B0DIPxxxxx | Chipotle Labneh Dip | Dip | $14.00 | 4.5 | 112 | Eternity Essentials |
| B0SRCxxxxx | Plant-Based Sour Cream | Dairy Alt | $14.20 | 4.4 | 96 | Eternity Essentials |
| B0DRKxxxxx | Coconut Probiotic Drink | Drinks | $3.00 | — | 0 | Whole Foods |
ASINs shown are illustrative placeholders; values reflect the structure and scale captured during analysis.
The point of an analysis like this is never the spreadsheet — it is the moves the spreadsheet makes possible. The six findings translate directly into actions a brand or an analyst can take this quarter.
None of these moves require insider information — only the discipline to collect public signals cleanly and read them honestly. That is the difference between managing a brand on evidence and managing it on hope.
We exist to remove the hardest part of this work: the pipeline. As an Amazon data scraping service, we handle the collection, cleaning, and structure so our clients do not maintain scrapers, fight CAPTCHAs, or wonder whether a blank cell is a real zero or a silent failure. They receive clean, validated, decision-ready data on a schedule that fits their planning cycle.
That means resolved parent-child mapping so formats and review counts are never miscounted, prices captured and tagged by seller so a multi-seller brand is read correctly, and quality assurance on every record so the analysis rests on data you can act on. Whether you need a one-time teardown like this one or continuous coverage across an entire category, the infrastructure headache is ours, and the insights are yours.
Want to see what this looks like for your category? We will pull a structured 50-product dataset at no cost.
Email info@iwebdatascraping.com with the subject line “Sample Dataset” and tell us the brand or category to analyze.
Start a projectCollecting publicly available product information — prices, ratings, review counts, sellers, and listing details — is a widely used practice for competitive and market research. We focus exclusively on public data, follow responsible collection practices, and never touch private or personal information. We are happy to discuss the specifics of your use case.
We capture and tag the selling entity behind every listing, so a brand offered by several sellers at different prices is read correctly rather than averaged into noise. For a brand whose strategy lives in its seller mix, that distinction is the entire point.
This is one of the most common places DIY scraping goes wrong. We resolve parent-child listing relationships explicitly, so the same flavor in a 4oz single, a 1lb tub, and a multiserve pack is mapped as related formats rather than triple-counted, and pooled reviews are flagged rather than double-counted.
Yes. While this case study focuses on Amazon, the same approach applies to Target, Walmart, and other major retailers, as well as cross-retailer comparisons. If your category lives across multiple storefronts, we can give you one unified view.
Clean, structured files ready for analysis — typically spreadsheets or a feed into your existing tools. The deliverable is built so a strategist can use it immediately, without a data-engineering step in between.
It depends on the number of products, the refresh frequency, and the retailers involved. We scope each engagement to your needs and pricing is predictable — no hidden engineering hours. Reach out for a quote tailored to your category.
We start by signing a Non-Disclosure Agreement (NDA) to protect your ideas.
Our team will analyze your needs to understand what you want.
You'll get a clear and detailed project outline showing how we'll work together.
We'll take care of the project, allowing you to focus on growing your business.